
Tick Stack | An Introduction to TICK stack for IoT
Introduction to TICK Stack
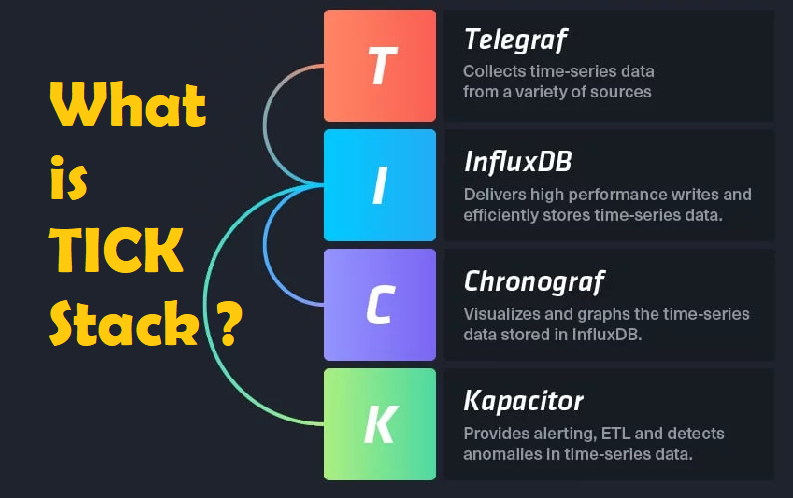
TICK Stack is a collection of open-source tools designed for monitoring, analyzing, and visualizing time-series data. It is developed by InfluxData and is widely used for real-time analytics, DevOps monitoring, IoT applications, and performance metrics tracking. The acronym TICK represents the four core components of the stack:
- Telegraf: A metrics collection agent
- InfluxDB: A time-series database
- Chronograf: A web-based visualization and monitoring tool
- Kapacitor: A data processing and alerting engine
Together, these components provide an efficient and scalable solution for handling time-series data.
Components of TICK Stack
1. Telegraf – Data Collection Agent
Telegraf is a lightweight, plugin-driven agent used for collecting and reporting metrics from a variety of sources. It is written in Go and supports multiple input and output plugins.
Key Features:
- Modular Design: Supports over 200 plugins for data collection from databases, IoT devices, cloud platforms, etc.
- Efficient and Lightweight: Uses minimal system resources.
- Wide Compatibility: Works with Linux, Windows, macOS, and other platforms.
- Custom Scripting: Supports custom scripts for data transformation.
Example Use Cases:
- Collecting system performance metrics (CPU, memory, disk usage).
- Fetching logs and data from IoT sensors.
- Monitoring cloud-based services (AWS, Azure, Google Cloud).
2. InfluxDB – Time-Series Database
InfluxDB is a high-performance time-series database designed for storing, querying, and analyzing time-stamped data. It provides SQL-like querying with InfluxQL and supports powerful data retention policies.
Key Features:
- Optimized for Time-Series Data: Stores data in an efficient compressed format.
- High Write and Query Performance: Can handle millions of writes per second.
- Retention Policies: Automatically deletes old data based on user-defined policies.
- Flux Query Language: Advanced data transformation and analytics capabilities.
- Horizontal Scaling: Supports clustering and replication for high availability.
Example Use Cases:
- Storing IoT sensor data.
- Monitoring network and application performance.
- Logging real-time financial transactions.
3. Chronograf – Visualization & Dashboarding Tool
Chronograf is the user interface component of the TICK Stack, allowing users to visualize and interact with the data stored in InfluxDB.
Key Features:
- Real-Time Dashboards: Drag-and-drop interface for creating custom dashboards.
- Pre-built Templates: Ready-to-use templates for system monitoring.
- User Management & Authentication: Supports OAuth, JWT, and LDAP authentication.
- Kapacitor Integration: Enables users to define alert rules and event triggers.
- SQL-like Queries: Supports InfluxQL and Flux for querying data.
Example Use Cases:
- Displaying real-time server performance metrics.
- Creating alerts and event notifications for system failures.
- Visualizing IoT data streams in interactive charts.
4. Kapacitor – Data Processing & Alerting Engine
Kapacitor is a real-time streaming and batch data processing engine that enables event detection, alerting, and automated actions based on data patterns.
Key Features:
- Event Processing: Detect anomalies and trigger events.
- Alerts & Notifications: Sends alerts via Slack, Email, Webhooks, PagerDuty, etc.
- Custom Scripts: Supports TICKscript for defining processing logic.
- Integration with AI/ML: Can be combined with machine learning tools for predictive analytics.
- Streaming & Batch Processing: Supports both real-time and historical data analysis.
Example Use Cases:
- Detecting anomalies in system performance logs.
- Triggering alerts when temperature sensors exceed a threshold.
- Automating responses to network failures.
How TICK Stack Works Together
The four components of the TICK Stack work in a pipeline to collect, store, visualize, and process time-series data. Here’s how the workflow operates:
- Data Collection: Telegraf collects data from various sources (servers, applications, IoT devices, etc.).
- Storage: The collected data is sent to InfluxDB for storage and indexing.
- Visualization: Chronograf fetches data from InfluxDB and presents it on dashboards.
- Processing & Alerting: Kapacitor continuously monitors the data and triggers alerts if any anomaly is detected.
This seamless integration enables real-time monitoring and automation of event-driven tasks.

TICK Stack vs Other Monitoring Solutions
| Feature | TICK Stack | Prometheus | ELK Stack (Elasticsearch, Logstash, Kibana) |
|---|---|---|---|
| Primary Focus | Time-Series Data | Metrics Monitoring | Log & Event Data |
| Database | InfluxDB | TSDB | Elasticsearch |
| Data Collection | Telegraf | Prometheus Exporters | Logstash/Filebeat |
| Visualization | Chronograf | Grafana | Kibana |
| Alerting | Kapacitor | Alertmanager | ElastAlert |
| Best Use Case | IoT, System Metrics, Financial Data | Cloud-native apps, Kubernetes | Log Analysis, Text Search |
TICK Stack is ideal for use cases involving real-time time-series data analysis and IoT applications.
Use Cases of TICK Stack
- IoT & Industrial Automation: Real-time monitoring of sensors and devices.
- DevOps Monitoring: Tracking system performance, CPU usage, disk space, and application metrics.
- Financial Services: Monitoring stock market trends and transactions.
- Smart Homes & Cities: Real-time energy consumption tracking.
- Cloud & Kubernetes Monitoring: Observing cloud resources and containerized applications.
Conclusion
TICK Stack provides a powerful, open-source solution for collecting, storing, visualizing, and analyzing time-series data. Its modular architecture allows users to build customized monitoring and alerting solutions, making it a preferred choice for DevOps, IoT, and data analytics applications. Whether you’re tracking real-time metrics or implementing predictive analytics, TICK Stack offers the flexibility and efficiency needed to handle time-series data at scale.
Recommended: InfluxDB | Installation | How To Use | Time Series Database ?


Pingback: Introducing the TICKscript language - IoTbyHVM - Bits & Bytes of IoT
Pingback: Introducing the TICKscript language - apalgorithm.com